<!-- Production bundle: external image assets, shared original portrait, lazy project images, resume download, SEO/share metadata. --> Aniruddha Kumar Tiwari | Data Analyst & Python Automation
Portfolio Experience / 2026
000 / 100
ANIRUDDHA
KUMAR TIWARI
SOFTWARE ENGINEERDATA ANALYSTINDIA
BUILDING SIGNALANALYTICS · AUTOMATION · DECISIONS
Software Engineer × Data AnalystIndia · Open to relocate / remote

ANIRUDDHAKUMAR TIWARI

I automate high-volume operational reporting and turn raw telemetry into decision-ready analytics — combining Python, SQL, BI and software engineering with hands-on telecom operations context.

PythonSQLPower BITableauPandas
Current focusOperational analytics → product-grade decisions
Aniruddha Kumar Tiwari
Software EngineerData Analyst direction
01 / Portrait
Scroll to explore ↓
1,032Automated report executions / dayRecurring production reporting workload
46Registered automation IDsRegistered workflows in the centralized runner
40Outage reporting scriptsCircle / cluster / vendor outage workflows
20Operational circles coveredPan-India operational coverage
10m→7sPer-report turnaround · ~98.8% fasterMeasured against prior manual preparation
Selected Projects

Systems built.
Insights unlocked.

Two layers of work: public-safe summaries of production automation, plus independent analytics labs designed to demonstrate SQL, experimentation, BI, EDA and business decision-making.

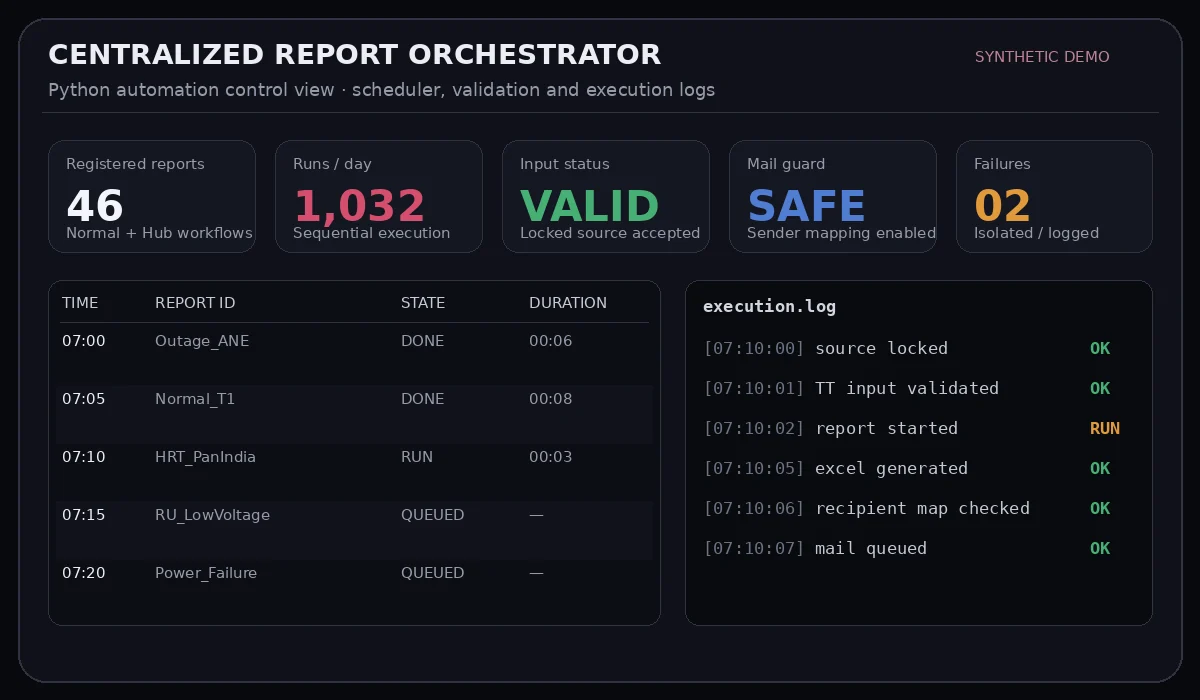
Centralized report orchestrator synthetic demoSynthetic demoOpen preview ↗
01 / Production systemAutomation · Reliability

Centralized 24×7 Report Orchestrator

Centralized multiple independent Python reporting workflows under a controlled execution layer with input validation, scheduling, operational logs, safe sender mapping and failure isolation.

PythonWindowsOutlook COMTelegramSchedulingValidation
Public-safe case study
View GitHub ↗
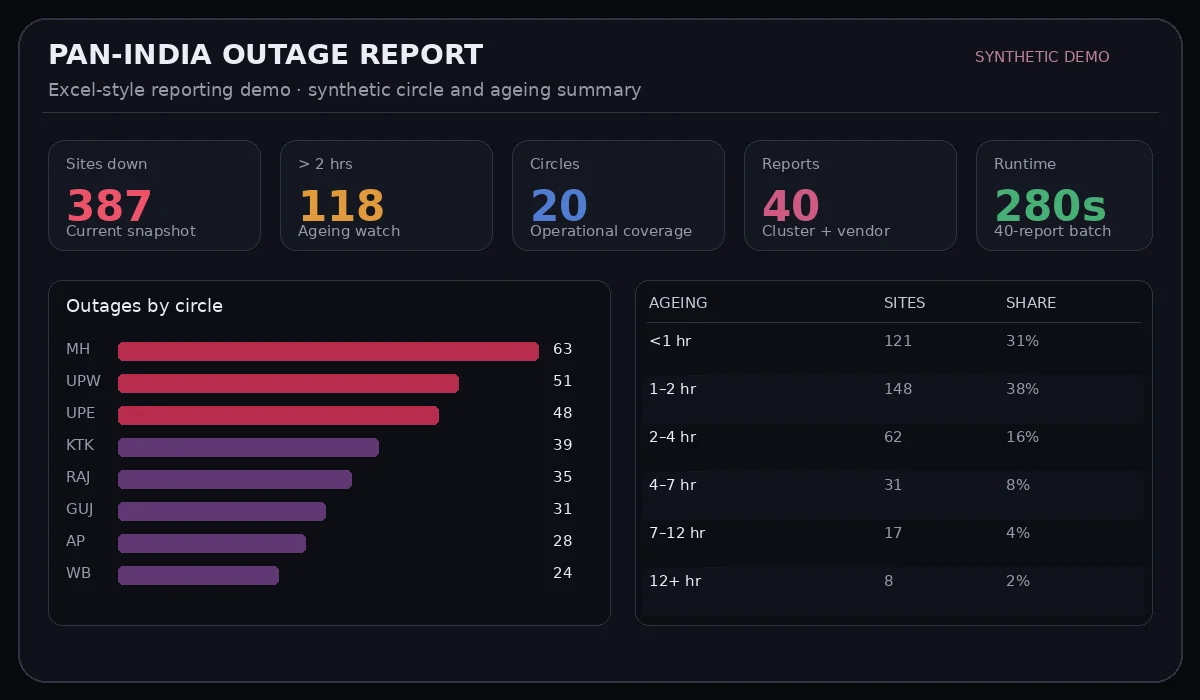
Pan-India outage reporting synthetic demoSynthetic demoOpen preview ↗
02 / Pan-IndiaReporting

Outage Reporting Automation

40 circle/cluster/vendor reporting scripts that build dashboards and distribute outputs automatically.

PandasOpenPyXLExcelOutlook
40 reports ≈ 280 sec
View GitHub ↗
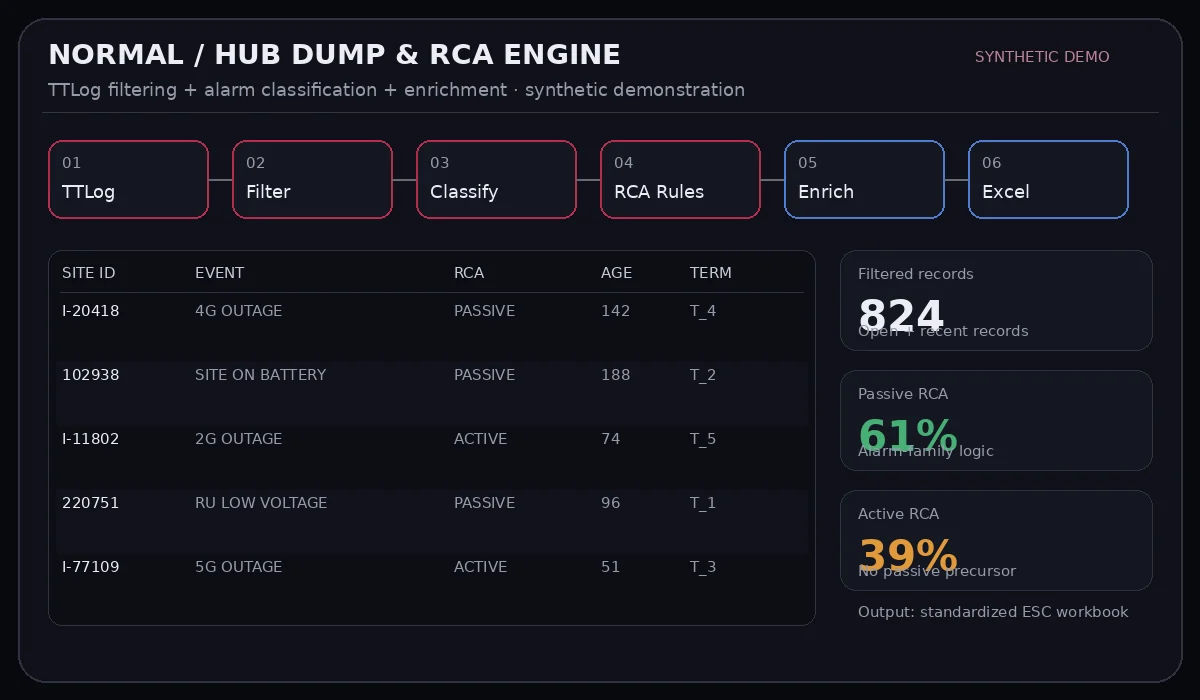
TTLog RCA engine synthetic demoSynthetic demoOpen preview ↗
03 / RCA engineData pipeline

Normal / Hub Dump & RCA Engine

Rule-driven TTLog filtering, alarm classification, master enrichment and standardized Excel output for operational escalation.

PythonPandaspyxlsbOpenPyXLBusiness Rules
Telecom analytics
View GitHub ↗
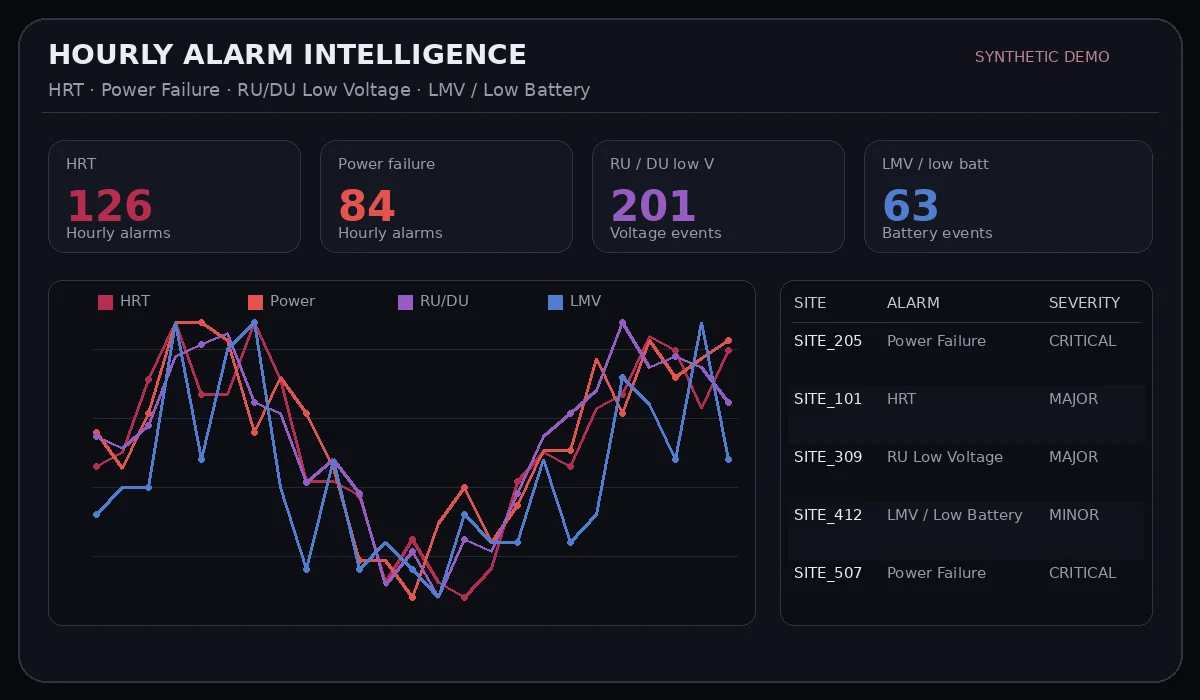
Hourly alarm intelligence synthetic demoSynthetic demoOpen preview ↗
04 / Alarm intelligenceAutomated dashboards

HRT · Power · RU/DU · LMV Dashboards

Hourly alarm dashboards, graphs and automated distribution for high-volume operational monitoring.

PythonExcel ChartsOutlookAutomation
No manual assembly
View GitHub ↗
05 / Portfolio labTelecom · Operations

Telecom Reliability Analytics

Synthetic incident dataset analyzed for downtime, SLA breach rate, recurring sites, alarm mix and RCA Pareto — built to demonstrate the analyst side of real operational context.

SQLPythonPandasPower BIRCA
Synthetic data · GitHub-ready
View GitHub ↗
Signup
View
Cart
Buy
06 / Portfolio labProduct analytics

Growth Funnel & A/B Testing

Conversion funnel, channel performance and treatment-vs-control analysis using event-level data.

SQLA/B TestCohortsPython
Experimentation
View GitHub ↗
07 / Portfolio labE-commerce

Customer & Revenue Intelligence

Revenue trends, return risk, RFM customer segmentation and high-value customer analysis.

SQLPythonRFMTableau
Business storytelling
View GitHub ↗
operations_sla_anomaly
breach rate · queue health
resolution time · reopen rate
IQR anomaly flags
output: team × priority KPI layer
08 / Portfolio labOperations

SLA & Anomaly Intelligence

Queue-health analysis that surfaces SLA breaches, abnormal resolution times and team/priority patterns.

SQLPythonAnomaly DetectionPower BI
Operational analytics
View GitHub ↗
How I Work

I connect the operational process, the data, and the decision — not just the dashboard.

01
Remove repetition

AUTOMATE

Convert repetitive operational work into reliable, repeatable workflows.

A
validated flow
02
Find the signal

ANALYZE

Validate the inputs, understand patterns, and turn raw data into clear insight.

D
decision layer
03
Drive the outcome

IMPROVE

Use the insight to prioritize action, improve reliability, and make the next cycle better.

↗

Workflow understanding→Automation→Validated data→Analysis→Better decisions

Professional Journey

NOC to
Data.

Employer/client names, production datasets, recipient lists, credentials and internal infrastructure are intentionally anonymized in this public portfolio.
Dec 2025 — Present

NOC Engineer · Automation & Analytics

Telecom Infrastructure Organization · Gurugram

  • Automate Excel-based reports and 24×7 scheduled operational workflows.
  • Monitor BSC, MSC, HUB and Normal sites; investigate outage RCA and support multi-level troubleshooting.
  • Operate and maintain RPA/report automation runtime and vNOC workflow components.
  • Built pan-India outage, alarm and dump-reporting systems covering 20 operational circles.
  • Reduced a typical report cycle from ~10 minutes of manual work to ~7 seconds of automated processing.
2020 — 2024

B.Tech · Computer Science & Engineering

Dr. A.P.J. Abdul Kalam Technical University · Uttar Pradesh

  • CGPA: 7.12 / 10
  • Computer science foundation across programming, databases, web development and software engineering.
  • Academic project exposure to road-environment perception for autonomous driving.
Recognition

Employee of the Month

Professional recognition

  • Also received manager/client appreciation for operational and automation contributions.
Aniruddha Kumar Tiwari
The Philosophy

Don’t just
report numbers.

Design the system that makes the numbers trustworthy. Understand the process, automate the repeatable work, validate the data, find the signal and communicate the decision clearly.

Capability Stack

Data core.
Engineering edge.

Built around the skill patterns repeatedly visible in high-bar analytics roles: SQL, Python, BI, data quality, experimentation, automation and the ability to translate operational questions into measurable insights.

Analytics

Query, explore, model and communicate.

SQLPythonPandasNumPyEDAStatisticsA/B TestingData Cleaning

BI & Data

Build reproducible datasets and decision-ready reporting.

Power BIPower QueryDAX · IntermediateTableauExcelETLData Visualization

Engineering

Automate, structure and ship practical systems.

Git / GitHubHTMLCSSJavaScriptReactOutlook COMOpenPyXLWindows Automation
Education & Credentials

Foundation.

Formal computer-science education, practical automation experience and continuing development across analytics and software.

Degree

Bachelor of Technology — Computer Science & Engineering

United College of Engineering & Research Centre, Greater Noida · Dr. A.P.J. Abdul Kalam Technical University · 2020–2024

7.12
CGPA / 10
Credentials

Programming · Data · Web

Coursework and certifications across Python, JavaScript, HTML, CSS, MySQL and Web Development through GUVI, Great Learning and Coursera.

PythonJavaScriptHTML / CSSMySQLWeb Development

Credential links can be added after verification; the portfolio does not display unverified certificate IDs.

Contact

LET’S BUILD
WITH DATA.

Prefer the one-page version?

Download Resume PDF ↓